Tập tin:65 Myr Climate Change.png
65_Myr_Climate_Change.png (650×397 điểm ảnh, kích thước tập tin: 21 kB, kiểu MIME: image/png)
| Tập tin này từ Wikimedia Commons. Trang miêu tả nó ở đấy được sao chép dưới đây. Commons là kho lưu trữ tập tin phương tiện có giấy phép tự do. Bạn có thể tham gia. |
Miêu tả
| Miêu tả |
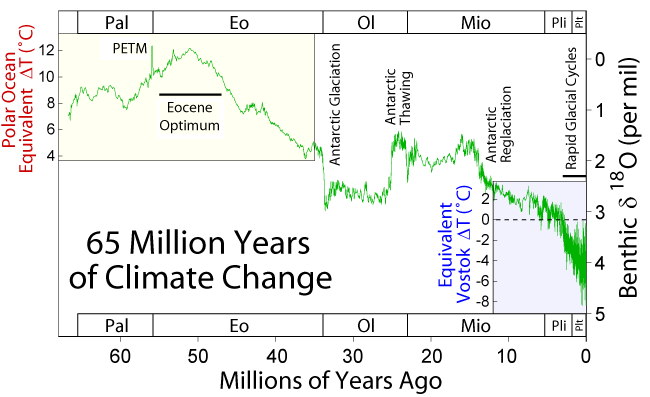
English:   This figure shows climate change over the last 65 million years. The data are based on a compilation of oxygen isotope measurements (δ18O) on benthic foraminifera by Zachos et al. (2001) which reflect a combination of local temperature changes in their environment and changes in the isotopic composition of sea water associated with the growth and retreat of continental ice sheets. Because it is related to both factors, it is not possible to uniquely tie these measurements to temperature without additional constraints. For the most recent data, an approximate relationship to temperature can be made by observing that the oxygen isotope measurements of Lisiecki and Raymo (2005) are tightly correlated to temperature changes at Vostok as established by Petit et al. (1999). Present day is indicated as 0. For the oldest part of the record, when temperatures were much warmer than today, it is possible to estimate temperature changes in the polar oceans (where these measurements were made) based on the observation that no significant ice sheets existed and hence all fluctuation in (δ18O) must result from local temperature changes (as reported by Zachos et al.). The intermediate portion of the record is dominated by large fluctuations in the mass of the Antarctic ice sheet, which first nucleates approximately 34 million years ago, then partially dissipates around 25 million years ago, before re-expanding towards its present state 13 million years ago. These fluctuations make it impossible to constrain temperature changes without additional controls. Significant growth of ice sheets did not begin in Greenland and North America until approximately 3 million years ago, following the formation of the Isthmus of Panama by continental drift. This ushered in an era of rapidly cycling glacials and interglacials (see figure at upper right). Also appearing on this graph are the Eocene Climatic Optimum, an extended period of very warm temperatures, and the Paleocene-Eocene Thermal Maximum (labeled PETM). The PETM is very short lived high temperature excursion possibly associated with the destablization of methane clathrates and the rapid buildup of greenhouse gases in the atmosphere. Due to the coarse sampling and averaging involved in this record, it is likely that the full magnitude of the PETM is underestimated by a factor of 2-4 times its apparent height. |
| Ngày | 17 December 2005 |
| Nguồn gốc | Tác phẩm được tạo bởi người tải lên |
| Tác giả | Robert A. Rohde |
| Giấy phép (Dùng lại tập tin) |
This figure was prepared by Robert A. Rohde from published and publicly available data and is incorporated into the Global Warming Art project. |
Giấy phép

|
Bạn có quyền sao chép, phân phối và/hoặc sửa đổi tài liệu này theo những điều khoản được quy định trong Giấy phép Tài liệu Tự do GNU, phiên bản 1.2 hoặc các phiên bản mới hơn được Quỹ Phần mềm Tự do; quy định; ngoại trừ những phần không được sửa đổi, bìa trước và bìa sau. Bạn có thể xem giấy phép nói trên ở phần Giấy phép Tài liệu Tự do GNU. |
| Tập tin này được phát hành theo Giấy phép Creative Commons Ghi công - Chia sẻ tương tự 3.0 Chưa chuyển đồi | ||
| ||
| Thẻ quyền này được thêm vào tập tin trong khi cập nhật giấy phép GFDL. |
Notes
- The data is plotted as a 10 point average of the original data to minimize measurement noise.
- The absolute calibration of the early part of the record relative to modern-day is somewhat uncertain, so that the entire scale may need to be shifted ± a few degrees for a true comparison to present.
- The labels on the top and bottom of the figure are abbreviations for different geologic epochs of the geologic time scale.
- The data shown is very useful, when observing a long period of time.
References
- Lisiecki, L. E., and M. E. Raymo (2005). "A Pliocene-Pleistocene stack of 57 globally distributed benthic δ18O records" (PDF). Paleoceanography 20: 1003. doi:10.1029/2004PA001071.[dead link]
- Petit J.R., Jouzel J., Raynaud D., Barkov N.I., Barnola J.M., Basile I., Bender M., Chappellaz J., Davis J., Delaygue G., Delmotte M., Kotlyakov V.M., Legrand M., Lipenkov V., Lorius C., Pépin L., Ritz C., Saltzman E., Stievenard M. (1999). "Climate and Atmospheric History of the Past 420,000 years from the Vostok Ice Core, Antarctica". Nature 399: 429–436.
- Zachos, James, Mark Pagani, Lisa Sloan, Ellen Thomas, and Katharina Billups (2001). "Trends, Rhythms, and Aberrations in Global Climate 65 Ma to Present". Science 292 (5517): 686–693. doi:10.1126/science.1059412.
derivative works
Derivative works of this file:
Lịch sử tập tin
Nhấn vào ngày/giờ để xem nội dung tập tin tại thời điểm đó.
| Ngày/giờ | Hình xem trước | Kích cỡ | Thành viên | Miêu tả | |
|---|---|---|---|---|---|
| hiện tại | 13:15, ngày 18 tháng 7 năm 2010 | | 650×397 (21 kB) | SeL media | time axis reversed |
| 22:51, ngày 17 tháng 12 năm 2005 |  | 650×397 (25 kB) | Saperaud~commonswiki | *'''Description:''' [[en:Image:{{subst:PAGENAME}}]] |
Trang sử dụng tập tin
Sử dụng tập tin toàn cục
Những wiki sau đang sử dụng tập tin này:
- Trang sử dụng tại ar.wiki.x.io
- Trang sử dụng tại bs.wiki.x.io
- Trang sử dụng tại ca.wiki.x.io
- Trang sử dụng tại cs.wiki.x.io
- Trang sử dụng tại da.wiki.x.io
- Trang sử dụng tại de.wiki.x.io
- Trang sử dụng tại en.wiki.x.io
- Miocene
- Oligocene
- Climate variability and change
- Paleocene–Eocene Thermal Maximum
- Foraminifera
- Ice sheet
- Antarctic ice sheet
- Geologic temperature record
- User:Dragons flight/Images
- Clathrate gun hypothesis
- User:Mporter/Climate data
- User:Debnigo
- Azolla event
- East Antarctic Ice Sheet
- Wikipedia:Reference desk/Archives/Science/2010 April 23
- User:GEOG430Anon/sandbox
- User:Pminhas97/sandbox
- 2021 in the environment
- User:Puddlesofmilk/sandbox/drafting
- Trang sử dụng tại en.wikibooks.org
- Trang sử dụng tại en.wikiversity.org
- Trang sử dụng tại es.wiki.x.io
- Trang sử dụng tại fa.wiki.x.io
- Trang sử dụng tại fi.wiki.x.io
- Trang sử dụng tại fr.wiki.x.io
Xem thêm các trang toàn cục sử dụng tập tin này.